
A manufacturing company trying to improve the quality of life for people all over the globe by pioneering solutions to two of the world’s largest problems: water and climate change. To stay competitive and innovative, the company undertook an initiative to better serve its business users by improving its BI. Using Microsoft Power BI and Azure, it was able to eliminate BI bottlenecks with its SAP system. Now the company’s business users are enthusiastically generating their own BI reports, which have increased by 535 percent in just two years.
Part of the company’s mission is to improve the quality of life for people all over the globe, and it’s pioneered solutions to two of the world’s biggest problems: water and climate change.
To stay competitive and work toward changing the world, the company continues to innovate and embrace technological advances. It continually explores various business cases for digital products, and in modernizing how its employees work with data, the company ended up on a journey to implement Microsoft Power BI and Azure.
The new implementation of modern tools at the company started when the BI department asked the business users how it could better support their needs.
BI bottleneck
Prior to the new solution, the BI department was considered a bottleneck when it came to creating reports and dashboards for all data from the factory, Internet of Things (IoT) devices, and core enterprise resource planning (ERP) systems. All report creations and changes had to be done through the BI department, including data extraction and analysis, and as a result, report development was slow.
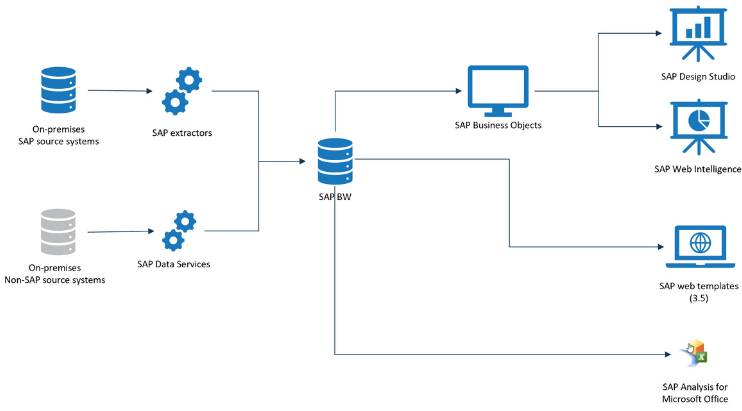
Prior to 2018, everything BI-related required using SAP tools such as SAP Lumira Designer, SAP BEx Query Designer, and SAP Data Services. Most of the business users weren’t allowed to use these tools, which created a gap between business users and BI consumption.
While business users were allowed to use SAP Lumira, it was missing capabilities to transform and merge data, and therefore, it could provide only a fraction of the data that users needed to analyze. Business users also found the tool to be limited and too technical, making working with it unappealing.
While the BI department created reports that delivered data, business users often took the data and created their own Microsoft Excel reports, customizing the information to their specific needs. This led to unproductive and time-consuming report creation, sprawling data, and challenges around local variations of reports. Keeping track of report alterations and making sure users were working with current data was nearly impossible.
The rise of Power BI pro
In 2017, many business users started to adopt power bi pro on their own because they found the tool easy to use and understand. The BI department took note of the popularity of Power BI Pro with business users and decided to take ownership of the tool and help implement it in a wider and more permanent distribution by using Power BI governance and management controls.
To create a cohesive process from source data to displaying it in Power BI, the BI department started to investigate cloud options, ultimately deciding that Azure was the best fit to work with Power BI.
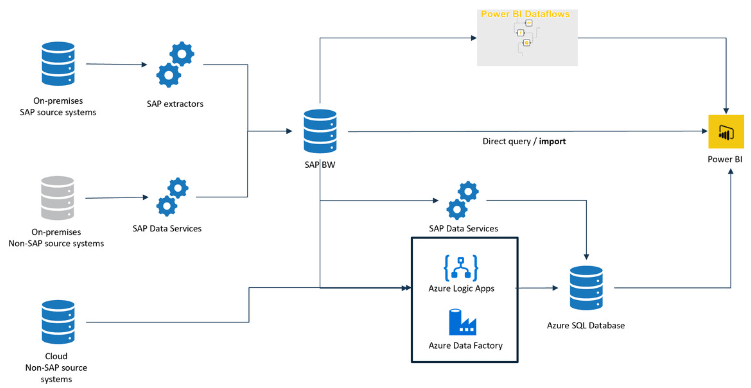
The company now uses both Azure and SAP Business Warehouse (SAP BW) as data sources for most of the services leading up to reporting in Power BI. When using data from SAP BW in Power BI reports, developers will either get the data directly from SAP BW by using the Implementation 2.0 SAP Connector for self-service or in an Azure SQL database through intermediate steps for larger projects.
For larger projects, data in SAP BW is extracted and transformed using Azure Data Factory. The data is then loaded into Azure SQL Database using Data Factory and imported into Power BI, or less commonly, is accessed through direct query. Many users still use the old SAP architecture for reporting, but all enterprise Power BI reporting occurs using the following Azure architecture.
In general, when people used SAP BW data, they received a fact table and then created dimensions from that fact table or from other queries, which was a difficult process to complete that didn’t provide the best developer experience. To solve this problem and provide centralized data to users, the BI department configured dataflows. With dataflows, users can get some general dimensions from SAP BW without having to create dimensions themselves, which they can then use within their Power BI reports.
Power BI dataflows are also being used to help with security models. To help maintain the same security layer throughout the pipeline, a security table is exposed through dataflows with a guide on how to connect through the data model to ensure that the same security setup is implemented in Power BI that exists in the source system from which users are taking data.
Using Power BI reports
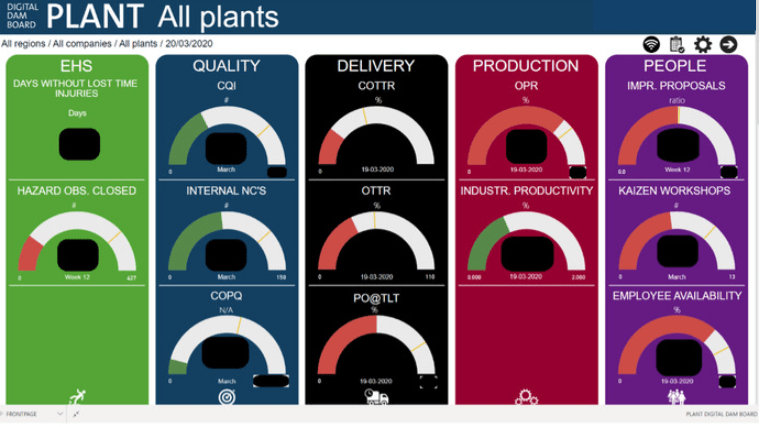
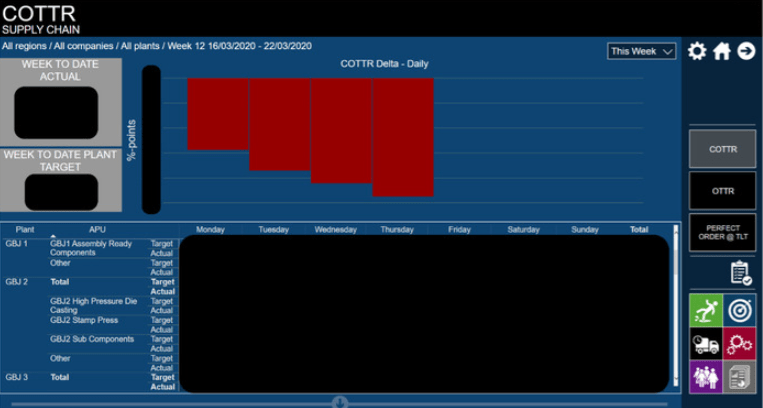
Self-service Power BI reports have enabled business users to quickly obtain the core data that they need and visualize it in a way to make the best possible decisions. The company uses Power BI in various categories and classes, such as a small group of users for one report, or on a bigger scale, a dashboard that displays on a large screen on a production floor.
The first two reports are optimized for use on TV screens in factories to help continually monitor and evaluate data. The third workload report is a central report for all developers to see their workloads on the capacity, and this report is available as an app to everyone at the company.

Self-service BI takes off
By taking advantage of self-service reports made in Power BI, reports are being generated much faster. With the new setup in Azure, the BI department now helps bring data to Power BI faster while maintaining a clear overview of what’s happening.
The BI department can spend its time on architecture and processes, while business users have been able to take over the role of creating reports. As a new addition in 2020, the BI department will continually be seeking out the best and most used self-service Power BI reports to promote to production status and use more widely throughout the company.
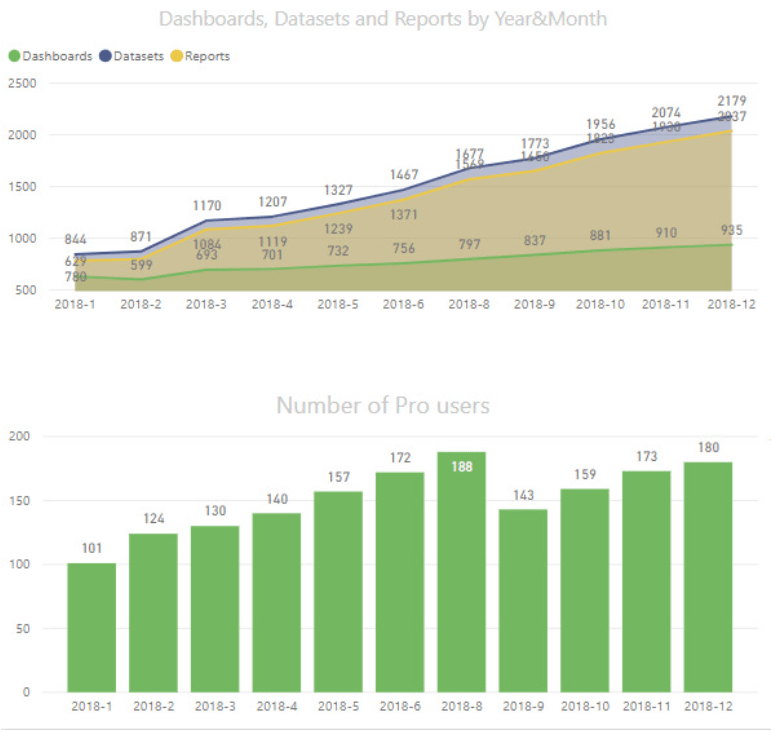
In just 2018 alone, the number of dashboards, datasets, and reports in Power BI skyrocketed. The organization went from 629 reports to 2,037 in just one year.
The numbers continued to grow in 2019, resulting in 4,000 Power BI reports throughout the company—a 535 percent increase in the number of reports in just two years.

Lessons learned
Throughout the journey of embracing Power BI and Azure, the company has had many ups and downs. The company discovered that one key to success is fostering a community for getting feedback on what users are struggling with and creating a space for people to help each other with questions. Early on, it implemented workshops for people to attend with their own data and reporting goals to get help from others who were also using Power BI. The company also held advanced Power BI sessions where the BI department and some consultants invited anyone who wanted to learn more about new features. The underlying agenda for these sessions was to have developers use newly introduced Power BI features in a responsible way from the onset.
Creating a place where users can learn skills up front makes it easier to do things the right way the first time instead of trying to fix things later. However, the company also learned that a powerful community takes time and resources to build.
The company also learned that having a well-structured and maintained data architecture makes a massive difference to users on the front end. Getting the BI department involved by taking over self-service BI and creating a flow of data using Azure helped create consistency and better performance across the company.
