
A leading hyperlocal food ordering and delivery platform company processes millions of customer orders each month while operating in 500+ cities with 120,000+ restaurants on its platform. One of the key goals for the organization is to build a data-driven culture by enabling democratization of insights throughout the organization. A robust BI platform was one of the first goals for this company.
Finding a tool to carry on with huge company growth
The company’s previous BI tool was complex and time consuming. Daily refresh of dashboards was delayed ~50-60% of the time due to data loading limitations and broken infrastructure. The lag in data led to poor stakeholder experience for deriving insights and using current data to make decisions.
Over the years, it continued to see remarkable growth as a company. Order volumes continued to grow, and the app expanded into multiple cities. As a result of the growth, dashboards had accessibility issues, functionality limitations, and increased security concerns that made for an unstable platform. All of these issues prompted the company to start looking for a better high performing BI solution that could keep up with the rapid growth of the organization.
Finding the right BI solution
In mid-2017, the company started the transformation of the BI platform to empower the entire organization with insights critical to business execution. The internal BI team gathered detailed requirements from different cross functional teams to choose the right BI tool which focuses on better features, smoother end-user experience with advanced access control.
The BI Team implemented proof of concepts on various tools to analyze reliability, scalability, and stress tested each tool with 5X increased data volume. The solutions were tested over several months. In the end Power BI prevailed as the best choice for them because it fulfilled the organization requirements and would be able to handle the growth and scalability to drive the data-driven culture.
Developing a strong data pipeline
The migration process to Power BI was straightforward. After selecting Power BI, the internal analytics team worked with BI experts to rapidly migrate a huge set of existing dashboards and convert them into minimal dashboards in Power BI within a short span of time. By November of 2017, the team went live with the new solution.
The new solution architecture gives freedom for analysts and content authors to access the data they need and use workspaces to create specific reports in Power BI while keeping the information protected and secure. Reports are currently created by business analysts and consumed by cross functional teams and leadership with dynamic row level security enabled and are maintained by the BI Center of Excellence. Their next step is to focus on self-service reporting.
Source data comes from locations like Snowflake (hosted in AWS), MySQL, Excel files, and prestoDB, using Open Database Connectivity. Aggregated tables are used for Power BI datasets to create measures and dimensions for visuals and reports.
The company is strategically taking advantage of Power BI’s open platform tools to solve problems before they arise and to have better models the first time around. Dax Studio is used to write, execute, and analyze DAX queries. VertiPaq Analyzer is used to optimize the data model. Power BI Helper assists in making day to day Power BI scenarios easier. Data is imported and set to refresh on certain schedules according to the need of the report.
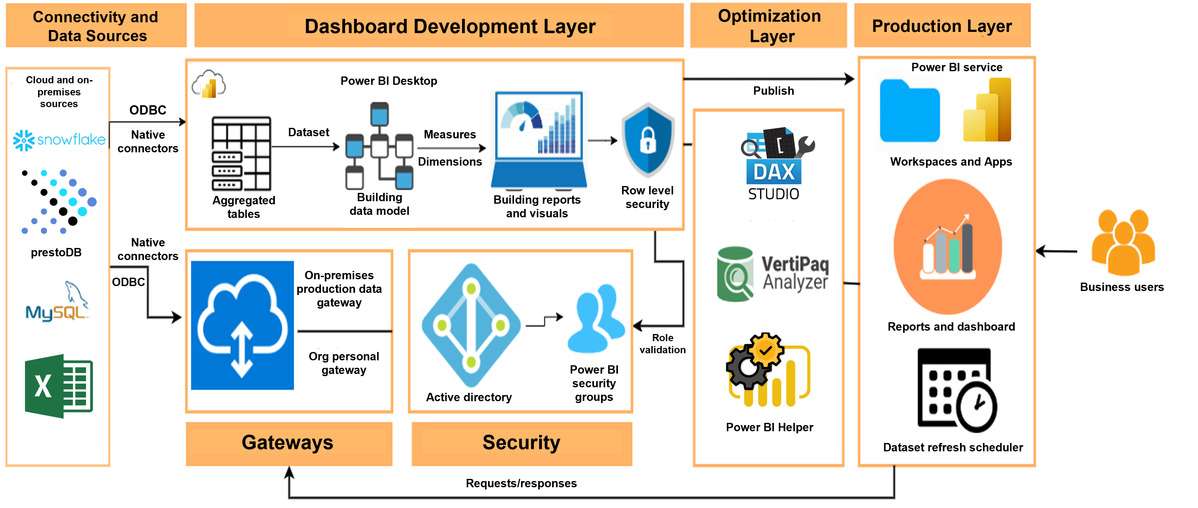
As a new age company, it had the benefit of starting its BI journey with no legacy systems and minimal technical debt. The company is able to have all data preparation needs delivered on a relatively small number of data sources using Power Query in Power BI Desktop without the need for an end-to-end data warehouse approach.
Using data in Power BI to make business decisions
The below dashboards visualize automatically aggregated data across multiple dimensions and allow drill down into the lowest granularity to gain a deeper understanding on supply, growth, business, marketing, and other facets of the business. The reports and visualizations help answer simple and complex questions and enable informed decision making.
Some of the questions that the Power BI reports help answer are:
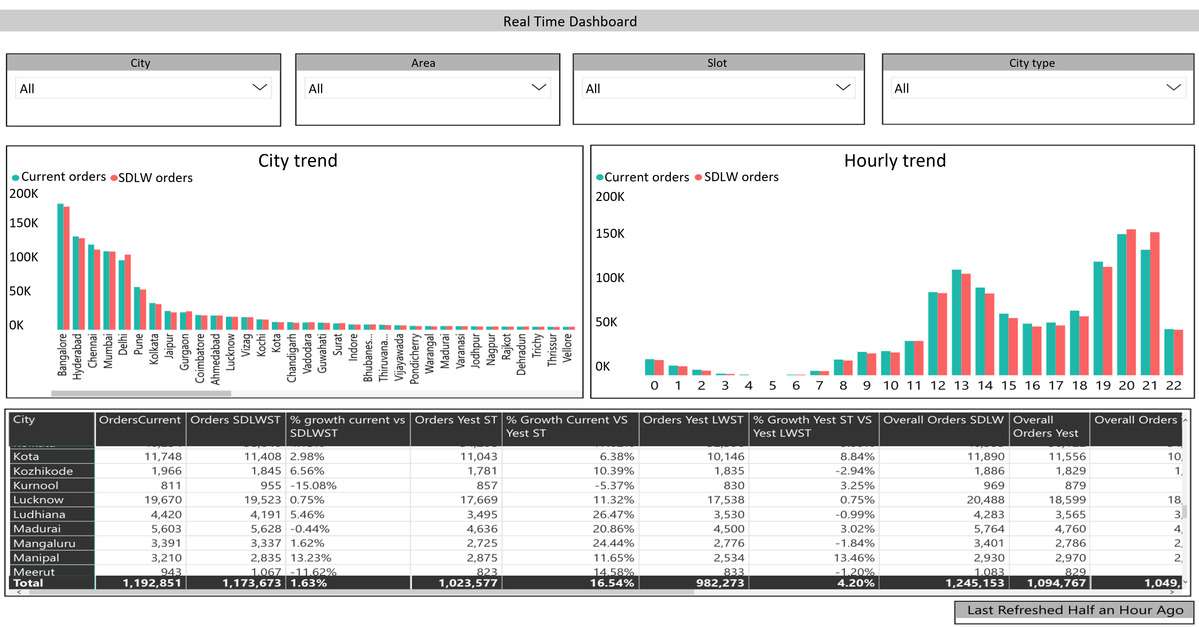
– What is the number of orders in the last hour?
– What cities are performing better week over week?
– What is the new campaign impacting sales?
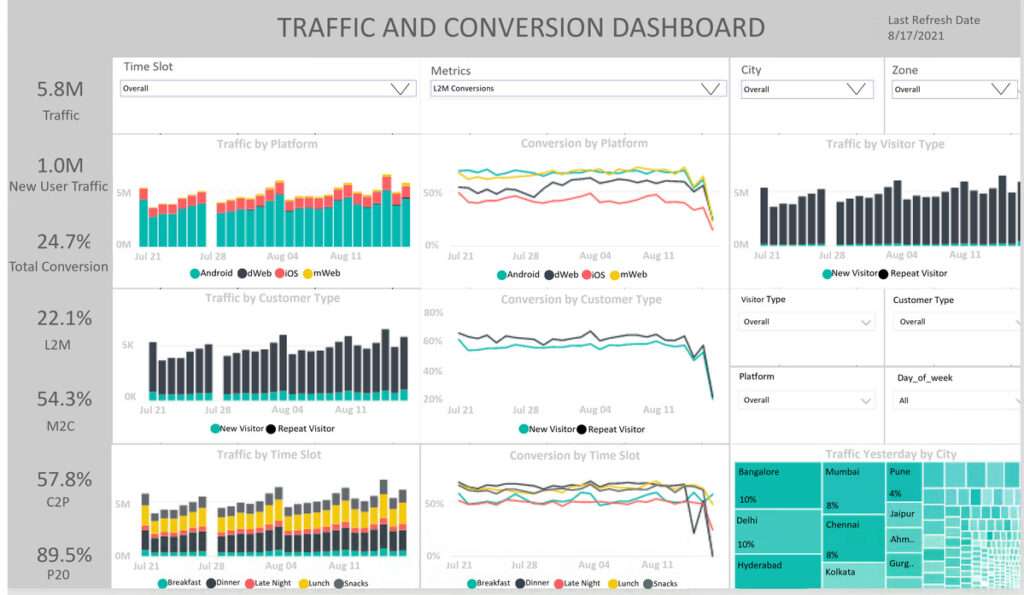
-Has the conversion rate improved in the last month?
The Real Time Metrics Dashboard tracks order trends per hour for the current day. Users of the report can see the amount of traffic each hour by city. This helps the company understand daily trends and make decisions accordingly.
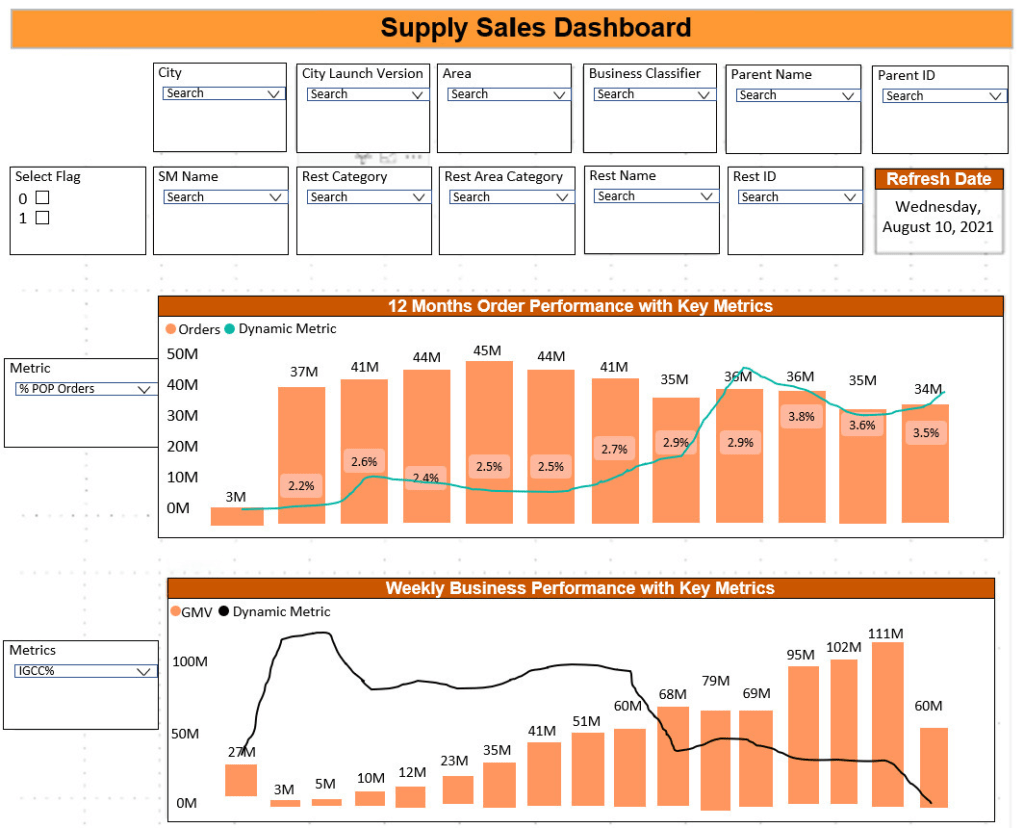
The Supply Sales Dashboard highlights order performance at the restaurant level tracking 10 different metrics that can be selected via the dropdown menu on the left.
The Traffic and Conversion Dashboard gives report consumers a view of app user behavior and adoption rate of the app. This dashboard helps the company understand new user traffic, types of visitors, platforms of app access, and time slots users are using the app.
The BI team creates and enforces a standard set of processes throughout development and production phases to ensure a fast, efficient, and consistent stakeholder experience.
A secure and cost-effective platform fit for company growth
In transforming their BI platform, the company has seen a variety of benefits. The centralized standardized BI solution helps to power key insights across the organization verticals with improved operational efficiency. Having the single platform allows report consumers to be familiar with only one tool, without having to learn the functions of multiple reports.
As it continues to grow, Power BI has the right platform to scale growth and deliver the right value.
Power BI provides the company with an overall lower total cost of ownership as well as saves time required for report and dashboard creation. This additional saved time helps analysts to spend their time driving better insights and making stronger decisions.
Future goals
In the future the company plans to focus more time on enabling and utilizing AI capabilities, Power BI dataflows, building common data models and incorporating R/Python visuals to enhance dashboard experience.
