
A dairy company focused on creating better-for-you products through the power of dairy nutrition. Originally owned by a co-op of dairy farmers, it has grown and launched numerous products and is now owned by the Coca-Cola Company. The company strives to make products that are better for people, animals, and the planet—and is harnessing the power of data to achieve that mission.
“We wanted usage to be intuitive, with the ability to use key targets and goals to cleanly tell stories.”
Senior Manager of Business Intelligence
Making the Move to Data-Driven Insights
The Senior Manager of Business Intelligence, previously worked as a sales manager at the company. In this role he worked with local Coca-Cola bottlers and their sales data. He was responsible for reporting on 11 different bottlers and distributors, logging onto their systems and downloading massive amounts of data to feed into large, unstable files. Getting valuable analytics and metrics from these files would take nearly seven hours of tedious work. As demand for these insights and analytics increased, Bristow knew the company needed to find a better way to quickly gain insights on large amounts of data.
He was introduced to a supply chain team that was using Power BI to report on shipment data. After seeing how much Power BI had improved the supply chain team’s workflow and efficiency, he was empowered to try finding a solution for his reporting issues with Power BI. With the company’s existing relationship with Microsoft and a quick proof of concept, it was easy to hit the ground running. The manager was able to plug into the existing on-prem model and quickly create an integrated ETL process for his 11 bottlers and distributors in just couple of weeks. Now answers that previously took seven hours to get are accessible almost instantly.
Collaborating to Build a Strong Solution
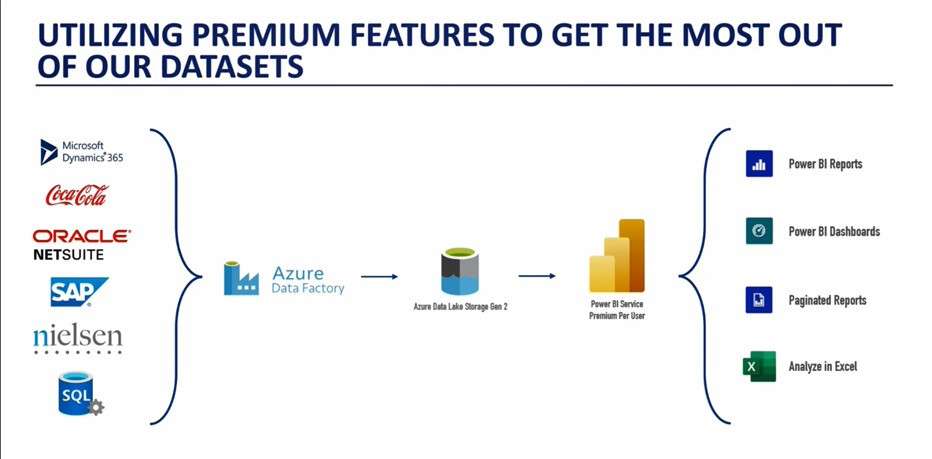
To build out a more comprehensive solution, the company partnered with Satori Reporting, a software company that offers pre-built Power BI reporting solutions for Oracle NetSuite, Sage Intact, and other popular SaaS products. The manager and his peers worked directly with the Chief Technology Officer at Satori Reporting, to help bring the company business intelligence vision to life. A proprietary ETL process was put in place to move data from multiple source systems into Azure Data Lake Storage Gen 2 via Azure Data Factory. Azure Data Factory and Azure Data Lake Storage were also used to extract data from Oracle NetSuite and make it available in any Power BI dataset. Once the data is in the lake, it’s extracted into one large Power BI dataset. Reports are then created based off the large Power BI dataset. End users can access data from Power BI reports, Power BI dashboards, paginated reports, and learn even more by utilizing the ‘Analyze in Excel’ functionality.
The company is using Power BI apps to organize reports for consumption, row-level security to ensure secure sharing of data with external partners, and perspectives to make it easier for end users to make their own reports. Power BI Premium licensing enables the company to utilize more features as well. Features such as paginated reports help properly deliver reports in PDF formats or in email subscriptions.
The company’s incorporation of the XMLA endpoint and use of Power BI deployment pipelines helps manage Power BI report changes from development, testing, and production workspaces. Utilizing deployment pipelines allows report developers to easily and safely make edits and updates to Power BI reports without needing to learn the steps of deployment or impacting the production systems.
Azure deployment pipelines were also used to manage the deployment of SQL schema changes and Power BI model changes. The pipelines are used on the same artifacts as XMLA endpoints to execute Tabular Editor command line functionality and deploy model updates. Like Power BI deployment pipelines, Azure deployment pipelines also make it simple for developers to access production environments and offer a safety net that eliminates extraneous errors.
Building Beautiful and Intuitive Reports
As the volume of ingested data grew, the company developed specific goals for their reports and dashboards. One of their goals was to ensure that each report told a story and allowed users to feel empowered by the data. Another goal was to prioritize intuitive design and allow people to easily understand data rather than feel intimated by it. Coming from a marketing and fine art background, the manager prioritized making sure reports looked clean with elegant design. “We wanted usage to be intuitive, with the ability to use key targets and goals to clearly tell stories.” says the manager.
The Annual Business Plan for Shipments Power BI report is one of the many examples of the company’s beautiful report design. The report is used by the senior leadership team to give a high-level overview of how the business is performing against the annual plan. Intuitive, single-click bottle visuals allow users to quickly see how a particular brand is performing. Brand performance can be compared to other brands and other points in the fiscal year to track growth and progress.
The Annual Business Plan Report has also integrated Nielsen syndicated data. The data provided by Nielsen measures the physical number of units and dollar volumes scanned for each retailer. Both values are important in evaluating business goals, and the manager wanted to offer a seamless way to understand the relationship between the two numbers. To successfully add the Nielsen data to reports, incremental refresh was needed. Thousands of rows of data were being added to an already giant dataset of Nielsen data. By using incremental refresh to only load modified data (rather than the entire dataset), file processing time was lowered by 70-80%.
The Volume Overview report was designed for internal sales teams to have better communication with the company’s distribution network. With many distributors and their respective data, sales teams can leverage the volume overview report to increase understanding and preparation for conversations with distributors. Business-user friendly features like pop-ups and drill down help sales teams get the information they need to make key decisions and conduct productive conversations with distributors.
To give the field team the opportunity to easily access data, the Void Report Generator was created. A user can drill down on the data in the report to an outlet/city level to see performance metrics by SKU, product line, or business unit. This level of granular detail gives distribution partners highly specific direction and detail to know what to ask from field sellers. With a couple clicks, users can organize data by specific time frames to fit their current needs. Data can also be quickly exported to Excel for easy collaboration between the field team and the distributor.
Finally, the Consumption Details report leverages Nielsen syndicated data to help the company employees see how their brands are performing against market competitors. The dashboard provides a clean and elegant high-level view of the company’s portfolio. When creating the dashboard, the manager wanted users to have a place to easily access one single source of truth. Users can filter by retailer and quickly toggle between volume, unit volume, price per unit, and more. Satori Reporting also helped the company use DAX to add a time-based view so users can track trends over various weekly timeframes.
Spreading the Data-Driven Mission
To encourage easy adoption, the manager created start-up guides for every new app or major report launched. The startup guide offers step-by-step instructions on how to use Power BI and get the most value out of the apps and reports. He has also created video recordings alongside startup guides to aid the adoption process.
Efficiency increased tremendously, as users can get their insights quickly and know that data is current. Creating a single source of the truth has allowed users to build trust in knowing that data is always up-to-date, accurate, and transparent. “[Power BI] has created an amazing amount of transparency. We like to think of it as data democratization across the company, giving people access to data in a single place, as that single source of the truth,” says the manager. Power BI has also improved decision making and really helped the company to easily meet and exceed the goals and objectives they set.
Building a Bigger and Better Reporting Platform
Currently, the fairlife data model features supply chain and sales information. However, the business intelligence team is actively working on adding Finance, Sustainability, People, and HR reporting to their model. In the future, the company wants to focus on creating central hubs for all things and to report end-to-end on the business. By leveraging Power BI to its fullest potential, it hopes to assess all aspects of the business to make sure it is hitting their goals while also fulfilling their values as an organization.
[Power BI] has created an amazing amount of transparency. We like to think of it as data democratization across the company, giving people access to data in a single place, as that single source of the truth.
Senior Manager of Business Intelligence
