
A Swedish company that is the world leading suppliers of tools, tooling solutions, and know-how for the metal working industry. It has extensive investments in research and development, creates unique innovations, and sets new productivity standards together with customers—including the world’s major automotive, aerospace, and energy industries.
As an industry-leading company, it needs access to data from all corners of the business. A manufacturing company generates a copious amount of data. Data is generated from sensors in machines, various operations, and multiple systems—and every piece of information is important. Collecting, using, and consolidating that data to give end-to-end business visibility became a goal of the company.
Gaining insights manually
The company’s journey of creating a global internal sales data warehouse solution started back in 2006, in collaboration with some Europe-based sales organizations. The company needed a process to analyze and understand internal sales throughout the company.
The initial solution foundation included Microsoft SQL Server and SQL Server Analysis Services. SQL Server Integration Services was used to process received data from a few business applications. The implementation quickly expanded to include additional sales organizations. With the growth of adoption of the solution came increasing complexity. The company consumed and transformed most data using Microsoft Excel, with some static reports developed using SQL Server Reporting Services.
With most of the reports Excel, it became difficult for anyone to get a full 360-degree view of sales. As people copy and pasted data from one Excel sheet to another, thousands of spreadsheets began circulating around the company. Ensuring that any one person had the complete report at any time was a challenge. As technology continued to advance, the company continued to invest in tools that would help it leverage data to propel the business forward.
A decade later, in 2016, the original solution began to hit roadblocks in trying to keep up with new business demands. While its systems and data warehouse solutions had been extremely beneficial in the past, the increasing requirements to focus on decreasing lead times and data latency forced the company to look into new ways of doing things. As time and data progressed, hardware investments grew more and more expensive. Daily users of the solution had grown to almost 3,000, and the system was starting to become overloaded.
Everything ran on 10-plus bare metal servers hosted in one of the company’s datacenters. Multiple sources and systems were used to store data, making it difficult to harmonize and consolidate information into one central location for analysis. Countless hours were invested every month just to keep the servers running. Dedication to these systems often took the time of multiple full-time employees to perform required system maintenance.
Business was also heavily dependent on IT resources to make any needed changes to SQL Server Reporting Services reports or the multidimensional model. Changes to production generally took around two months, leading to delays in making certain business decisions.
Finding a new solution
With the strain of limited resources, new demands on the system, and continuing hardware costs, the company needed a new solution. The company invested a large chunk of time to review solution requirements and sought to implement a long-term innovative solution instead of sticking a bandage on the problem.
The goal of the new solution had two clear targets—reduce total cost of ownership and decrease time-to-market for new functionality. With a 10-year-old architecture, finding tools that would continue to connect the 20-plus production sites of data and allow for more advanced analytics was a massive challenge.
With the increase of technology throughout the years, naturally more and more company data has become available. The new architecture would also need to support these bigger volumes of data, provide quick refreshes visible by end users, and have self-service capabilities, all while adjusting for a decade of changes in the company business model with history of multiple code workarounds.
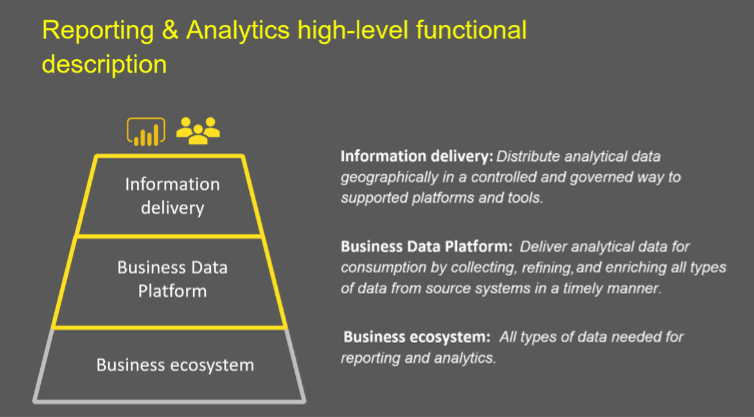
The new solution needed to provide a 360-degree view on all the business data generated from all corners of operations. Becoming a data-driven company would be key to maintaining a strong position and growing future business. The new solution needed to have easy access to high-quality data with low latency and allow for deep analysis and insights with statistical functions and algorithms.
The overall goal was to have efficient and structured data at the core to provide leadership with meaningful and accurate information in a timely way.
The first implementation
The company eventually decided on third-party tools and began implementing a completely “greenfield” modern data warehouse solution. The chosen solution fit nicely with the current Enterprise Business Platform and was projected to bode well with the overall IT strategy.
Twelve months into the project, it became clear that the initial tools of choice did not adequately meet the needs of the organization. A thorough review and assessment of the project and solution was undertaken. During this assessment, 12 important criteria were created to help determine the right solution.
The assessment criteria were:
- Knowledge
- Maturity
- Delivery
- Flexibility
- Cost
- Support
- Agility
- Data processing
- Innovation
- Integration
- Data-driven culture and self-service business intelligence
- Data science
After focusing on choosing tools with these 12 key areas, the decision was made to immediately change direction and implement Microsoft tools, including Azure and Power BI. The combination of advanced technical solutions and the seamless connection with Office 365 made Power BI an easy choice.
Azure for the solution
The on-premises bare metal server hosting was the first barrier to address. The first step was to lift and shift the current server setup in the datacenter to Azure Virtual Machines. This quick upgrade allowed for savings of hardware costs and the ability to adjust the performance of the virtual machine (VM)s. As the new solution started to take shape, the Azure VMs allowed the old solution to scale down incrementally in conjunction.
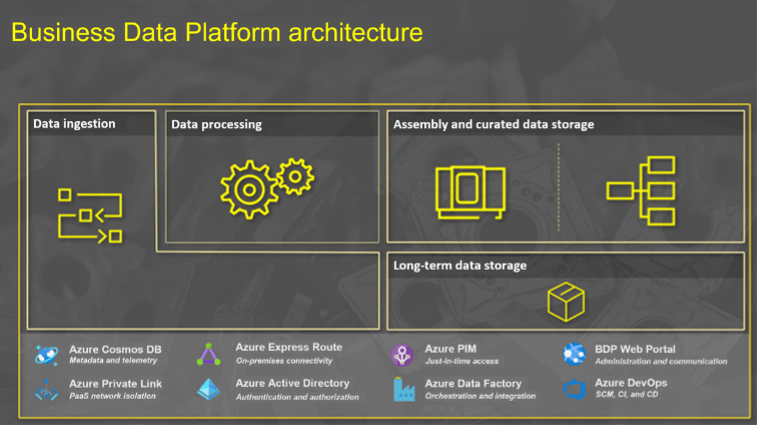
With the new solution in place, more Azure technologies are being used. Now, there are a plethora of ways to integrate with the Business Data Platform (BDP) and adjust to source system requirements or internal/external security and information security policies. The solution relies on Azure API Management with Azure Logic Apps or Azure Functions for REST-full patterns and an Azure Storage account for bulk uploads. When it comes to pull integrations, Azure Data Factory is used for both on-premises systems and third-party software as a service (SaaS) applications.
The company uses Azure Cosmos DB to build a reactive data platform and for features such as autopilot, change feed, and bulk uploads. Using features like autopilot allows for adjusting the large amounts of telemetry data emitted from components without having to redesign tables. The use of change feed allows the company to be more reactive to certain events while combining with SignalR to serve end users with real-time information through the BDP web portal. With Azure Cosmos DB, scaling geographically is simple and requires very little change to the application, allowing the company to be well positioned for whatever comes up in the future.
Azure Data Factory is used as an orchestration engine for keeping track of data flows and sourcing up or triggering Azure Functions. The company uses Data Factory in a modern way that allows it to break things down into modules to make it easier to make changes to the solution.
Data Factory reads instructions from Azure Cosmos DB for a single set of packages and pulls from different locations into different sources and destinations. All established integrations are defined in metadata and stored in Azure Cosmos DB—giving full traceability and control over management of data regardless of integration used. Every event or file received is tagged, allowing for tracking of incoming data through the whole process pipeline all the way to consumption by the end user.
Data is harmonized early in the process and deduplicated using Azure Functions for executing logic along with Azure Service Bus to handle messaging between the different components. The components perform a variety of tasks including normalizing big and complex XML structures into more usable data sets and adding relevant business keys to the received data. Using these serverless technologies allows the company to scale capacity down or up depending on the peaks and valleys of data processing demand.
To keep track of parallel processing, all components generate events that are ingested into Azure Cosmos DB and tied to the initial parcel identifier. This gives a real-time view of each individual parcel received, alerts on potential problems, and bottlenecks displayed in a Platform Operations dashboard.
Once data has completed processing, it is continuously persisted into Azure Data Lake Storage Gen2, including the original file from the source system and the more structured processed data. The data lake services allow the storage of any type of data of any size at a very low cost and with great read and write performance.
Data Lake Storage Gen2 also allows for good connectivity to services such as Azure Databricks and Azure Machine Learning. Data scientists then work with updated data instead of copying data between services.
All models are hosted in Azure Synapse. These models provide the business logic needed to enable self-service reporting and analytics within the organization. The star-schema model(s) can be easily accessed with Power BI. Azure Synapse deeply interoperates with Power BI to drive insights for all users.
To keep networking traffic and data sources and integration endpoints clear of the public eye, Sandvik Coromant utilizes Azure Express Route and Azure Private Link to isolate used platform as a service (PaaS) resources within the corporate network. This has taken burdens off the shoulder of the IT security team and also simplified access management when it comes to serving data to users all around the globe in a more secure way.
Using Power BI
The company has incrementally replaced QlikView, Excel, and 300 SQL Server Reporting Services reports with Power BI. IT uses Power BI to build reports that are easily accessible by business users, give them a holistic picture of what’s going on with sales, and eliminates the need to download and email Excel reports from person to person.
One of the main reports, the Big Sales Report, is the most used dashboard in the company. The report receives 180,000 views every 90 days by more than 1,600 people. The people viewing the report range from the president of the company to anyone in the sales departments.
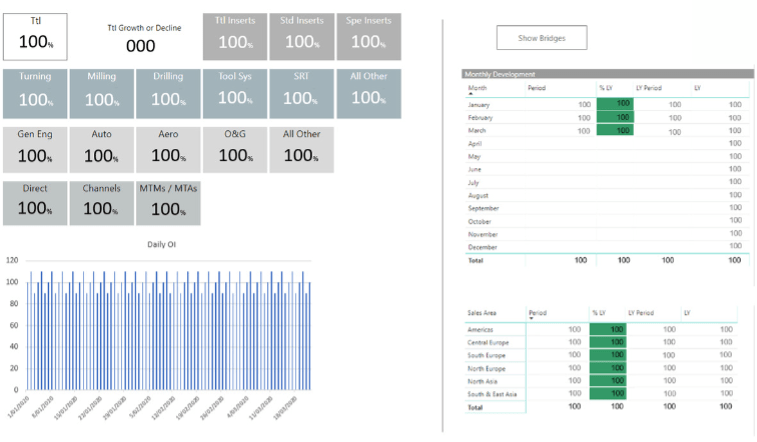
The Big Sales report shows historical sales by dates. The first page of the dashboard gives a high-level overview with the ability to drill down to granular levels of orders all the way to specific order codes on specific dates. The report can also contain views showing trendlines, average sales per day, developed products, and customer perspectives.
The Big Sales report is the primary tool for sales analysts to determine how to move forward with their business plan. While the Big Sales report currently focuses on a lot of historical information, the company is working on developing accurate forecasting and predictive analytics to look toward future sales instead of just past ones. Using these reports and finding ways to look up to five quarters ahead will allow the company to support customers in a better way and run the business better.
Because of the success of the Big Sales report, other dashboards are being rolled out for finance, HR, pricing perspectives, product management, supply chain, and more. The company is taking away the need for individuals to develop reports in Excel and Qlik and have created a core team to manage content around the globe. There are now more than 11,000 reports throughout the whole company.
Implementing a CoE
Along with the new technologies, the company also created a dedicated Power BI CoE to support business users with authoring reports and doing analysis. The concept was based around bringing existing skilled resources in the company into a central function, where all time was dedicated to creating critical mass to support all functions and requirements within the business.
Today this function consists of 12 employees spread across the globe who provide the majority of all reporting, intelligence, and analysis for the business. This has allowed the company to take a big leap when it comes to making data-driven decisions while dramatically reducing the time spent working on various phases of data gathering, transformation, and analysis.
The team has deep business and process understanding in selected areas such as supply chain, production, sales, or marketing and also a deep understanding of Power BI. They ensure consistency in published reports, reducing time spent validating numbers and creating one source of truth for all departments. Employees now have more time to focus on opportunities to increase customer satisfaction instead of creating spreadsheets.
Benefits
With Azure and Power BI, the company can now access data in one place in order to analyze information in Power BI. The Business Data Platform allows business users to focus on strategic solutions instead of wrangling data and maintaining expensive hardware costs.
With Azure, the company has a large toolbox that requires little to test new services or experiment on how to make things faster and more stable. The flexibility of Azure allows the company to continue to drive improvement on its platform and innovate while staying relevant with changes in Azure services.
Because of Azure, employees spend less time on integration and have more time to gain insights from the data in Power BI. Being able to drill down into information and double-click on details allows business users to deliver greater value.
