
A world leader in industrial automation and information company provides automation solutions to a broad range of industries such as oil and gas, mining, food and beverage, and automotive. It has been serving customers for more than 115 years and takes pride in its focus on innovation, domain expertise, culture of integrity, and corporate responsibility.
In 2014, the company’s leadership initiated the setup of a business intelligence center of excellence (BI CoE) to provide the enterprise with meaningful business insights through high-quality data and information. This function was placed within the finance team to create dedicated focus on standardizing BI reporting and systems.
The VP Data Analytics & Insights joined the team at the company. During the initial phases, the team worked on expanding the focus from reporting to bringing in more data and analytics. Some of the key accomplishments were implementation of a master data management solution, self-service analytics, and improved BI throughout the organization.
That same year, the company expanded the function to data analytics and insights by bringing in more focus on advanced analytics, AI/machine learning, and enterprise integration strategies. It made significant investments and created the right opportunities to upgrade the team skills to help adapt to modern-day data management, analytics, AI/machine learning technologies, and best practices.
The key is not just azure, but it is how integrated the (parts of the) azure solution are with each other, and we are seeing that with Azure Synapse Analytics. (Azure Synapse Analytics has truly integrated all of these pieces together)
Enterprise Architect
In 2019, as a part of the company’s Data Analytics & Insights (DA&I) evolution and expansion, 2 employees were hired as enterprise architects within the DA&I department. They hit the ground running when they joined the team. With extensive knowledge of data architecture and Microsoft Power Platform, both employees quickly became go-to people for questions and suggestions. Using their expertise and enthusiasm, the DA&I team is now growing and empowering the user community.
Changing to an agile environment
Before implementing Microsoft Azure platform as a service (PaaS), the company used Azure infrastructure as a service (IaaS), Cloudera, SQL, SAP HANA, and Microsoft Power BI technologies to provide DA&I solutions. Although the environment was on the Azure cloud platform, this technology landscape had its challenges, since it was self-managed, and lacked the DevOps and CI/CD processes to enable an agile approach.
To create a more successful overall business experience, the company acknowledged the need to make the technology landscape more agile and responsive. The solution needed to have data in a centralized location while decentralizing IT as the only source for data reports. It envisioned a solution where reports could be made and updated by business users without requiring executive approval.
Migrating from IaaS to PaaS
The initial solution began with self-service Power BI as part of the migration to the cloud setup using an IaaS strategy, with Cloudera and Impala in place for managing data in a data lake. Over time, costs of the IaaS deployment started building up.
The company had already decided it wanted Power BI as its main visualization tool. Selecting the right PaaS solution to partner with Power BI was the next step. It determined that ease of platform integration, ability to keep up with demand, and overall costs were pivotal in the chosen solution.
Initially the team chose a solution that was not based on Azure to incorporate data consumption and storage. After difficulties with a disconnected and high-effort implementation, the team decided to switch to an Azure PaaS solution. This move to Azure has been vital in the complete success of the company’s journey.
According to one of the hired architects, “The key is not just Azure, but it’s how integrated the (parts of the) Azure solution are with each other, and we are seeing that with Azure Synapse Analytics. (Azure Synapse Analytics) has truly integrated all of these pieces together.”
Putting to solution in place
When the two employees joined the company’s Data Analytics & Insights team in summer of 2019, they started strong with the goal to empower business users to have a data-driven mindset. By implementing Power BI, they motivated employees to look at data first, and then expand individual perspectives to uncover information and build out critical solutions through making informed business decisions. By providing the right tools, the team helped consumers to take their local and domain-specific knowledge and rapidly home in on key drivers for business to change the way the organization operates.
They determined that success of the new solution would be defined by each business unit having the ability to build out their own reports and perform their own analytics—on a team or individual level.
Using Azure and Power BI, the team designed a solution using Microsoft modern data warehouse architecture and following Microsoft best practices. The new solution allows the company’s analytics environment to do the following:
- Create a unified platform for all analytical needs
- Provide more robust self-service report and model development capabilities
- Offer advanced analytical features such as data science, machine learning, and necessary data access to end users to meet critical business requirements
- Optimize storage, compute and scalability, reducing total cost of ownership across the analytics platform
- Embed DevOps with automated testing to facilitate CI/CD for enhanced delivery speed and quality
- Create a more realistic target platform for SAP Business Warehouse (BW) and legacy retirement
- Provide high availability and disaster recovery services for DA&I assets
Arriving at the detailed solution
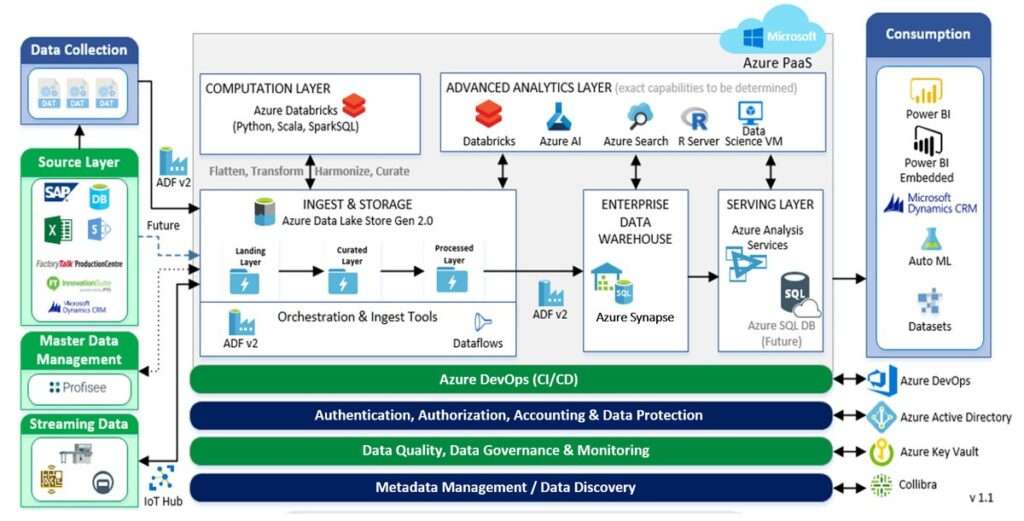
The company has embarked on a journey from on-premises, with a stopover at IaaS, and has now arrived at its PaaS solution. Throughout the entire pipeline, Azure Data Factory manages all orchestration of data ingestion and azure DataBricks is used for computation and transformation.
First, all sources are ingested, transformed, and processed into Azure Data Lake Storage Gen2 using Data Factory. Then, data in Data Lake Storage Gen2 is flattened, transformed, and curated using Azure Databricks and ingested back into Data Lake Storage Gen2.
Data Factory is also used to load data into Azure Synapse Analytics (previously Azure SQL Data Warehouse). Azure Synapse Analytics then presents data through Azure Analysis Services and loads it into a data mart for independent reporting teams to transform and present the information through Power BI and automated machine learning capabilities in Azure.
The advanced analytics layer sits on top of the entire process. Using Microsoft Azure Databricks, Azure AI, Azure Cognitive Search (previously Azure Search), and R data, scientists are able to perform advanced analytics for deeper insights.
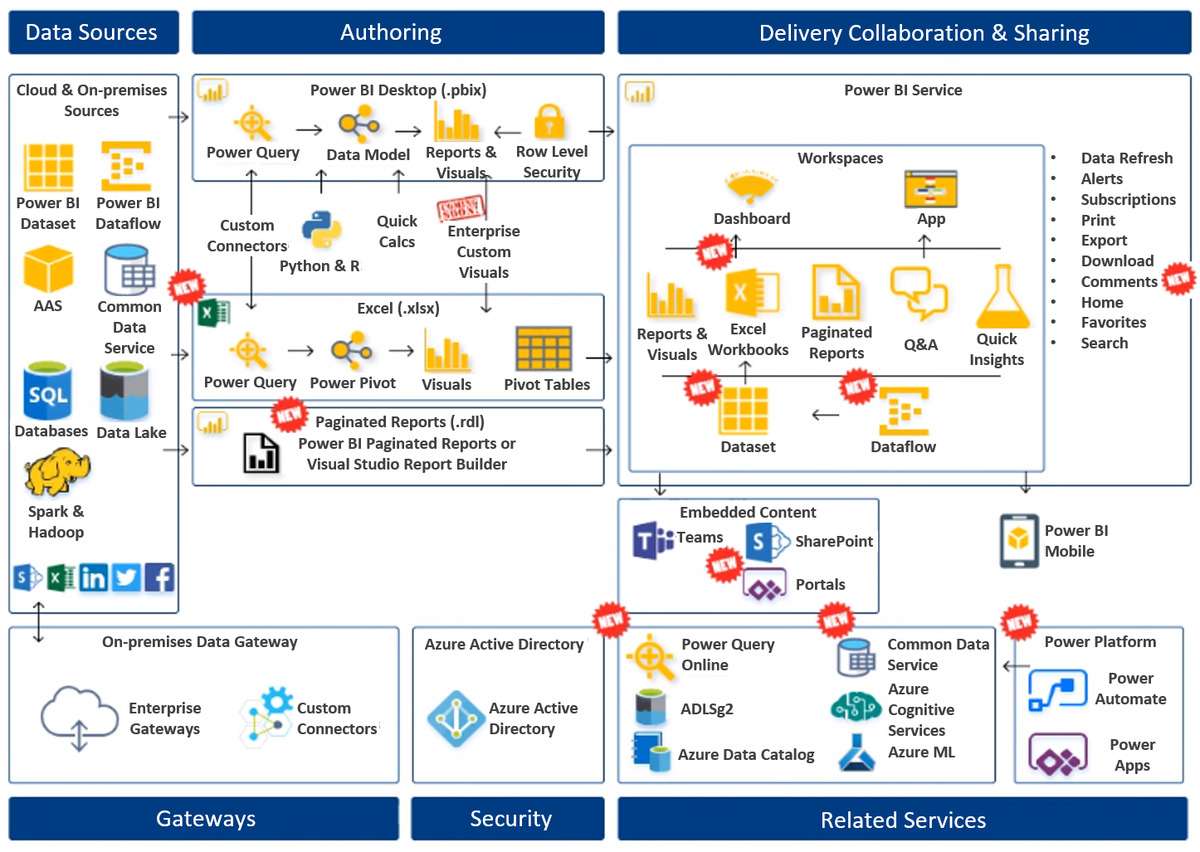
Before one of the architects joined the company, the company was only using dashboards, reports, and visuals with Power BI desktop. Now, it has incorporated multiple Power BI capabilities and features. The team is using Excel workbooks, paginated reports, Q&A, quick insights, data flows, and Common Data Service. The company is also capitalizing on Microsoft Power Platform products Microsoft Power Automate and Power APPS to become an even more agile and responsive enterprise.
Seeing the solution in action
The company has been taking advantage of the new PaaS infrastructure throughout it in a variety of ways.
The HR team recently implemented a new method of evaluating employees using Azure and Power BI. In conjunction with Power BI developers, the HR department designed a process that includes using the data in the data lake, Power Apps, and Power BI to allow managers to rate employees based on specific metrics in a secure manner utilizing proper roles and security restrictions.
Using Power Apps, an app is embedded into Power BI to input the employee data and contains all data into one place. The results are immediately available to analyze and determine employees that are at risk of leaving the company, key employees of focus, employees who are high performers, and other metrics.
This entire solution was designed, developed, and rolled out in just three weeks. This kind of project used to take years to plan and execute, but now with Microsoft advanced technology, the company is able to create full solutions in a fraction of the time.
Training consumers
Recognizing that improvements to the architecture would improve self-service and grow the user community, the employee looked into enhancing the education and support offerings from the DA&I team. Through participating in the existing Power BI user group, Power BI Yammer group, and working directly with users, he gained an understanding of the user communities’ skills and needs.
He determined that knowledge of Power BI in the company could be enhanced. He polled the user community and developed presentations for monthly Power BI user group meetings.
The employee started posting to the user group’s Yammer channel daily with helpful information and answers to questions from users. Recognizing that the DA&I team could not be on call to assist users whenever the need arose, he introduced the concept of Power Hours, a weekly two-hour session where users can meet with members of the DA&I team and each other to work through questions and challenges. In addition, he developed the DA&I Sample App, which gives users a starting point in Power BI Desktop and encourages consistency and best practices.
Introducing Power hours
Power Hours is taking self-service at the company to the next level. To introduce the concept and generate interest, the DA&I team hosted a kickoff event with presentations and training breakouts hosted by Microsoft and the DA&I team. More than 400 people signed up for the event within 24 hours of the announcement, confirming the need and appetite of the Power BI user community.
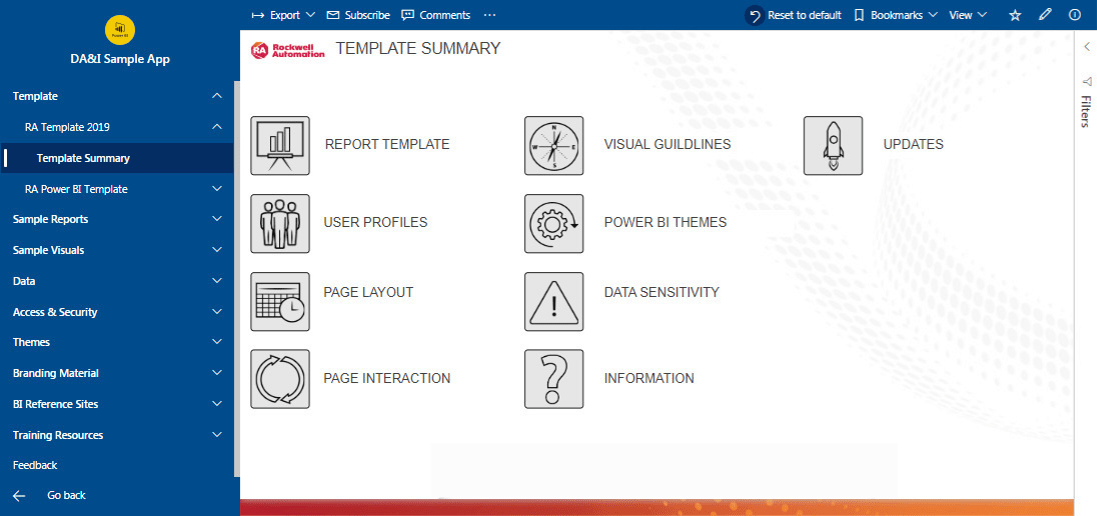
The DA&I Sample App includes guidance for creating reports, sample reports, and the company’s template. Users can learn about topics such as page interaction and visual guidelines, and can copy and use any of the elements of the app. The app also includes reports to look up content owners and Pro License holders.
