
Get ready for future data analytics
Microsoft Power BI is a leading self-service tool that allows business users to quickly link. It visualizes data for ad-hoc analysis on their own. Microsoft’s analytics service is so much more! As an integral part of Azure Cloud Services, it expands into an enterprise-wide data platform that combines Reporting, Data Analytics, Data Science and Internet of Things.
It helps you build your unstructured data into a structured one so you can understand it well to allow your business to run better. With Microsoft power bi you can connect to data, model, and visualize your data as you like.
The parts of Microsoft Power BI
It consists of several elements that all work together, starting with these three basics:
– A Windows desktop application called Power BI Desktop.
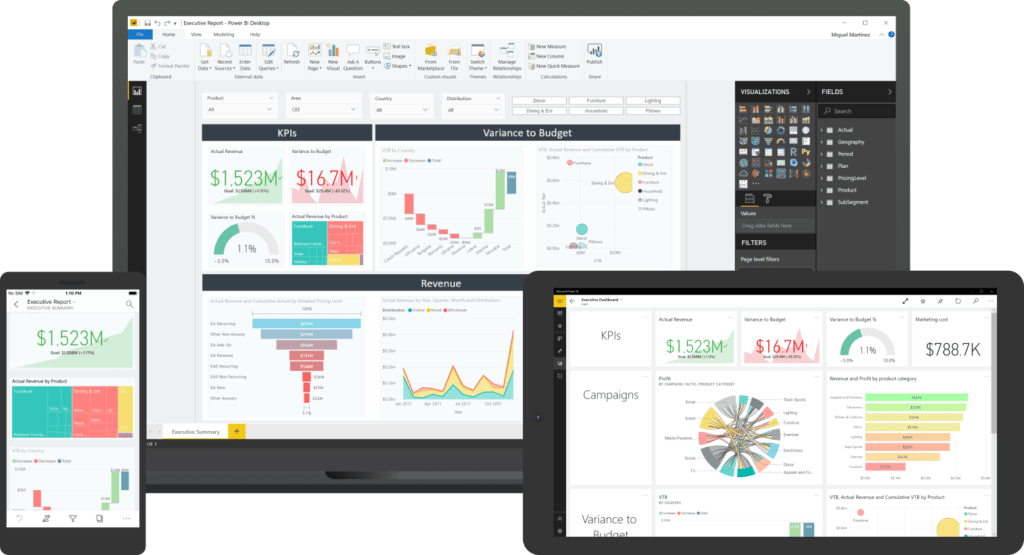
– An online SaaS (Software as a Service) service called the Power BI service.
– Power BI mobile apps for Windows, iOS, and Android devices.
These three elements — Power BI Desktop, the service, and the mobile apps — are designed to let you create, share, and consume business insights in the way that serves you and your role most effectively. Beyond those three, Power BI also features two other elements:
– Power BI Report Builder, for creating paginated reports.
– Power BI Report Server, an on-premises report server where you can publish your Power BI reports, after creating them in Power BI Desktop.
What are the features of Microsoft Power BI?

Power BI supports stream analytics from factory sensors to social media sources, it supports real time analytics to make timely decisions.
It is one of the media sources of power BI. You can access various sources of data such as Excel, CSV, SQL server, etc to your visualizations.

It is another vital feature of Power BI. By dealing with complex data, power bi ‘s default standard might not be enough in some cases. In that case, you can access the custom library of visualization that meets your needs.
What are components of Microsoft Power BI?
Power Query:
It is the data transformation and mash-up engine. It enables us to discover, connect, combine, and refine data sources. It can be downloaded as an add-in for excel or can be used as part of Power Business Intelligence desktop.
Power Pivot:
It is a data modeling technology that lets you create data models; It also allows you to establish relationships and create calculations. Power pivot uses data analysis expression ( DAX) language to model simple and complex data.
Power View:
It is a technology that is available in Excel, SharePoint, SQL server, and Power BI. It lets you create interactive charts, graphs, maps and other visuals that brings your data to life.
Power Map:
It is a 3D data visualization tool that lets you map your data. It works with Bing maps to get best visualization based on latitude, longitude, or country, state, city, and street address information.
Power BI Desktop:
It is a development tool for Power Query, Power Pivot, and Power view. With Power Business Intelligence Desktop, you have everything under a same solution, and it’s easier to develop business intelligence and data analysis experience.
Power Q&A:
It is a natural language engine for questions and answers to your data model. Once you’ve built your data model and deployed that into Power Business Intelligence website, then you can ask questions and get answers easily.
What is Power BI visualization
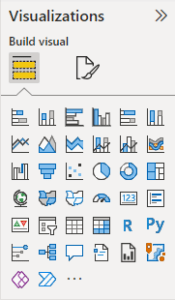
Visualizations display insights that have been discovered in the data. A Power BI report might have a single page with one visual or it might have pages full of visuals. In the Power BI service, visuals can be pinned from reports to dashboards.
It’s important to make the distinction between report designers and report consumers. If you’re the person building or modifying the report, then you’re a designer. Designers have edit permissions to the report and its underlying dataset. In Power BI Desktop, you can open the dataset in Data view and create visuals in Report view. In the Power BI service, you can open the data set or report in the report editor in the Editing view. If a report or dashboard has been shared with you, you’re a report consumer. You’ll be able to view and interact with the report and its visuals but you won’t be able to make as many changes as a designer can. There are many different visual types available directly from the Power BI Visualizations pane.
Why do companies need Power BI
Whether it’s using interactive dashboards to consolidate key metrics or rich reports to connect datasets from workloads, Power BI is a pivotal mechanism to engage with business data, pull the data from a wide variety of different sources, and allow smarter data-driven choices. Power BI provides data preparation and discovery, interactive dashboards, rich visualizations in one solution, as well as self-service capabilities. It makes it an intuitive tool to communicate with data and converts it into insights faster.
Benefits of Power BI
Simple: Power BI makes it impressively simple to bring your data collectively into one place for more exceptional accessibility, organization, and visibility in your reporting efforts. Power BI has a very simplistic and straightforward to use interface.
You don’t need programming training or experience to use Power BI. It has built-in intelligence to help users select their reports’ attributes by recommending the most suitable reporting element. For example, after choosing the right data source, when you opt for sales and category, the program will automatically identify the map chart if you select sales and location. Beginners and experts can use the Power BI desktop for quick explanations of increases or decreases in your data charts by right-clicking at a data point and choosing the analyze button.
Mighty: It’s called Power BI for a reason – it is mighty. Power BI also executes automated, incremental refreshes to assure data is continuously up-to-date, a priceless asset that streamlines visual reporting for end-users. In short, Power BI efficiently merges and loads millions of records into memory for a faster and more agile data analysis experience for end-users.
Governance: Power BI brings together data governance and security. Power BI allows users to manage security and user access within the same interface, eliminating the need to use other tools to guarantee you meet rigorous compliance and regulatory standards.
Powerful Answers to Deeper Level Questions: Power BI allows you to ask questions about your data and get them answered. Power BI combines natural language search interfaces to enable users to create visualizations and uncover insights using search terms in plain English, without requiring code or syntax. When you use the Q&A feature, you can easily explore particular insights by double-clicking an empty part of your report canvas and using the ‘Ask a Question box to ask data-specific questions like “what were the sales for my region last quarter?” As you type, Power BI automatically lists associated meaningful queries and a preview of a chart or table visualization that best represents the data you’re looking for. Voice recognition is even supported with Power BI, allowing you to ask for information on the go.
What is Power BI data modeling?
Data modeling is undoubtedly one of the most important parts of Power BI development. The purpose of data modeling in Power BI is different from data models in transactional systems. In a transactional system, the goal is to have a model that is optimized for recording transactional data. Nevertheless, a well-designed data model in Power BI must be optimized for querying the data and reducing the dataset size by aggregating that data.
While not everyone has the luxury of having a prebuilt data warehouse, you end up creating a data model in Power BI in many cases. It is very tempting to get the whole data as is from various data sources and import it to Power BI. Answering business questions can quickly translate to complex queries that take a long time to process, which is not ideal. So, it is highly advised to resist the temptation to import everything from the data sources into Power BI and solve the problems later. Instead, it is wise to try to get your data model right so that it is capable of precisely answering business-driven questions in the most performant way. When modeling data in Power BI, you need to build a data model based on business logic. Having said that, you may need to join different tables and aggregate your data to a certain level that answers all business-driven questions. It can get worse if you have data from various data sources of different grains representing the same logic.
Power BI implementation
When you implement Power BI, there are many subject areas to consider. The following subject areas form part of the Power BI implementation planning series:
- BI strategy
- User needs and opportunities
- Authoring tools and user machines
- Tenant setup
- Subscriptions, licenses, and trials
- Roles and responsibilities
- Power BI service oversight
- Workspaces
- Data management
- Content distribution and sharing
- Change management and deployment
- Security
- Information protection and data loss prevention
- Power BI Premium
- Gateways
- Integration with other services
- Auditing and monitoring
- Adoption tracking
Scaling and growing
What is the difference between a dashboard and a report?
A dashboard, also known as canvas, is a visualization with multiple charts and graphs to tell a story. It is limited to a single page that contains the highlights of that story. while a report is a multi-perspective view into a dataset, with visuals that represent different findings and insights from that dataset. A report can have a single visual or pages full of visuals.
